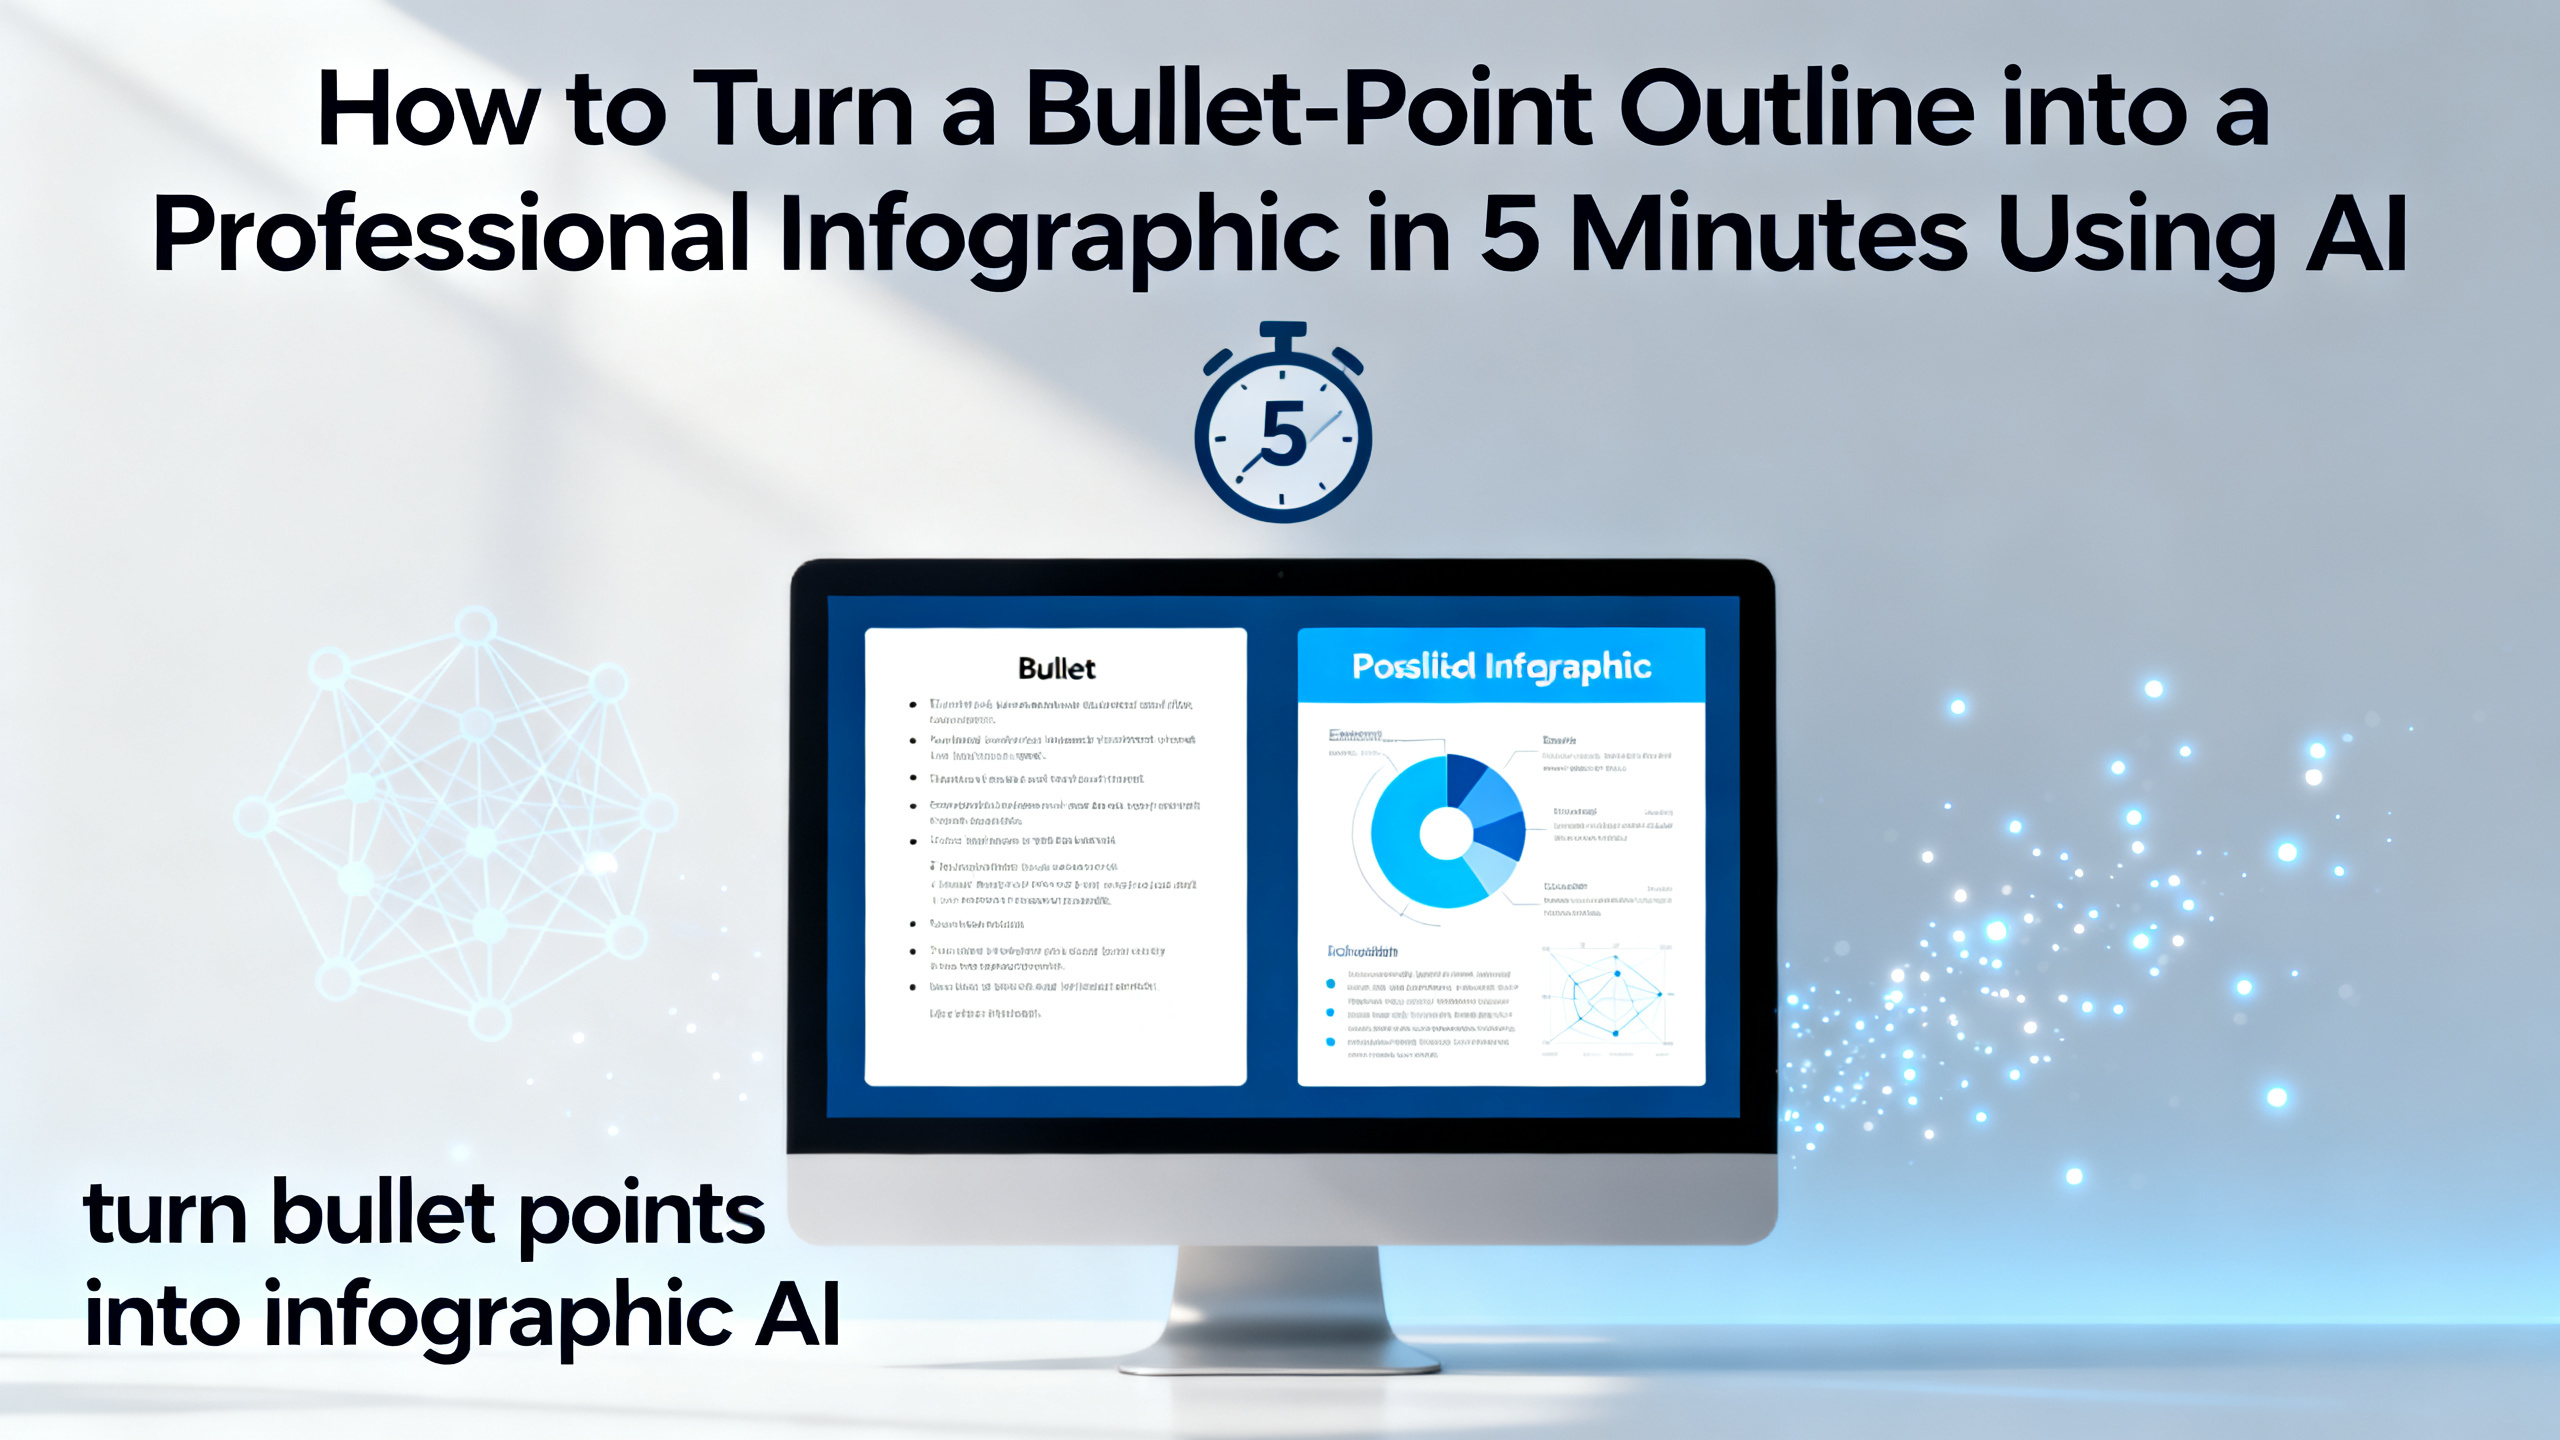
How to Turn Bullet Points into Infographic AI in 5 Minutes
You have a bullet-point outline ready, but turning it into a visual infographic feels like a design chore. Whether you're a marketer racing to meet a campaign deadline, a teacher preparing a lesson handout, a consultant summarizing data for a client, or an operations lead needing a quick process chart—this guide is for you. In this step-by-step tutorial, you'll learn exactly how to turn bullet points into infographic AI tools like 1bit AI Infographic Generator can handle in under five minutes. We'll cover the best AI infographic generator workflows, how to create infographic from outline without any design skills, and practical tips to make your text to infographic AI output look professional. By the end, you'll be able to transform any list into a shareable visual asset.
Quick answer
Yes, you can turn bullet points into infographic AI in under five minutes using a dedicated text-to-infographic tool. Simply paste your outline, choose a template, and let the AI generate a layout with icons, colors, and hierarchy. The result is a professional infographic ready for download or sharing.
- Paste your bullet-point outline directly into the AI infographic generator.
- Select a template that matches your content type (list, process, comparison).
- The AI automatically maps each bullet to a visual element (icon, chart, or text block).
- Customize colors, fonts, and layout in seconds—no design skills needed.
- Export as PNG, PDF, or shareable link for presentations and social media.
- New users get free credits to try the tool immediately.
Why Turn Bullet Points into Infographic AI?
Bullet points are great for organizing ideas, but they rarely engage an audience. When you turn bullet points into infographic AI, you transform a plain list into a visual story that grabs attention and improves retention. Studies show that people remember 65% of visual information three days later, compared to only 10% of text. For marketers, this means higher click-through rates on social media. For teachers, it means better comprehension in the classroom. For consultants, it means clearer client presentations. Using an AI infographic generator like 1bit AI, you can create infographic from outline in minutes—no graphic design degree required. The AI understands your content structure and automatically selects icons, color schemes, and layouts that match your message. This is especially powerful for process flows, comparison charts, and data summaries. Instead of spending hours in design software, you can focus on refining your message while the AI handles the visuals. The best part? New users get free credits to test the workflow before committing.
Use 1bit AI Infographic Generator when you want a faster workflow
Imagine you have a list of five key benefits for a product launch. Instead of opening Canva and manually dragging icons, you paste the list into 1bit AI, pick a template, and get a polished infographic in seconds. The AI even suggests which bullet points work best as icons versus text blocks. That's the power of a dedicated text to infographic AI tool. Try it now with free credits.
Create InfographicsStep-by-Step: How to Turn an Outline into an Infographic Using AI
Follow these five steps to turn bullet points into infographic AI with 1bit AI Infographic Generator. Each step includes a pitfall to avoid and an actionable tip.
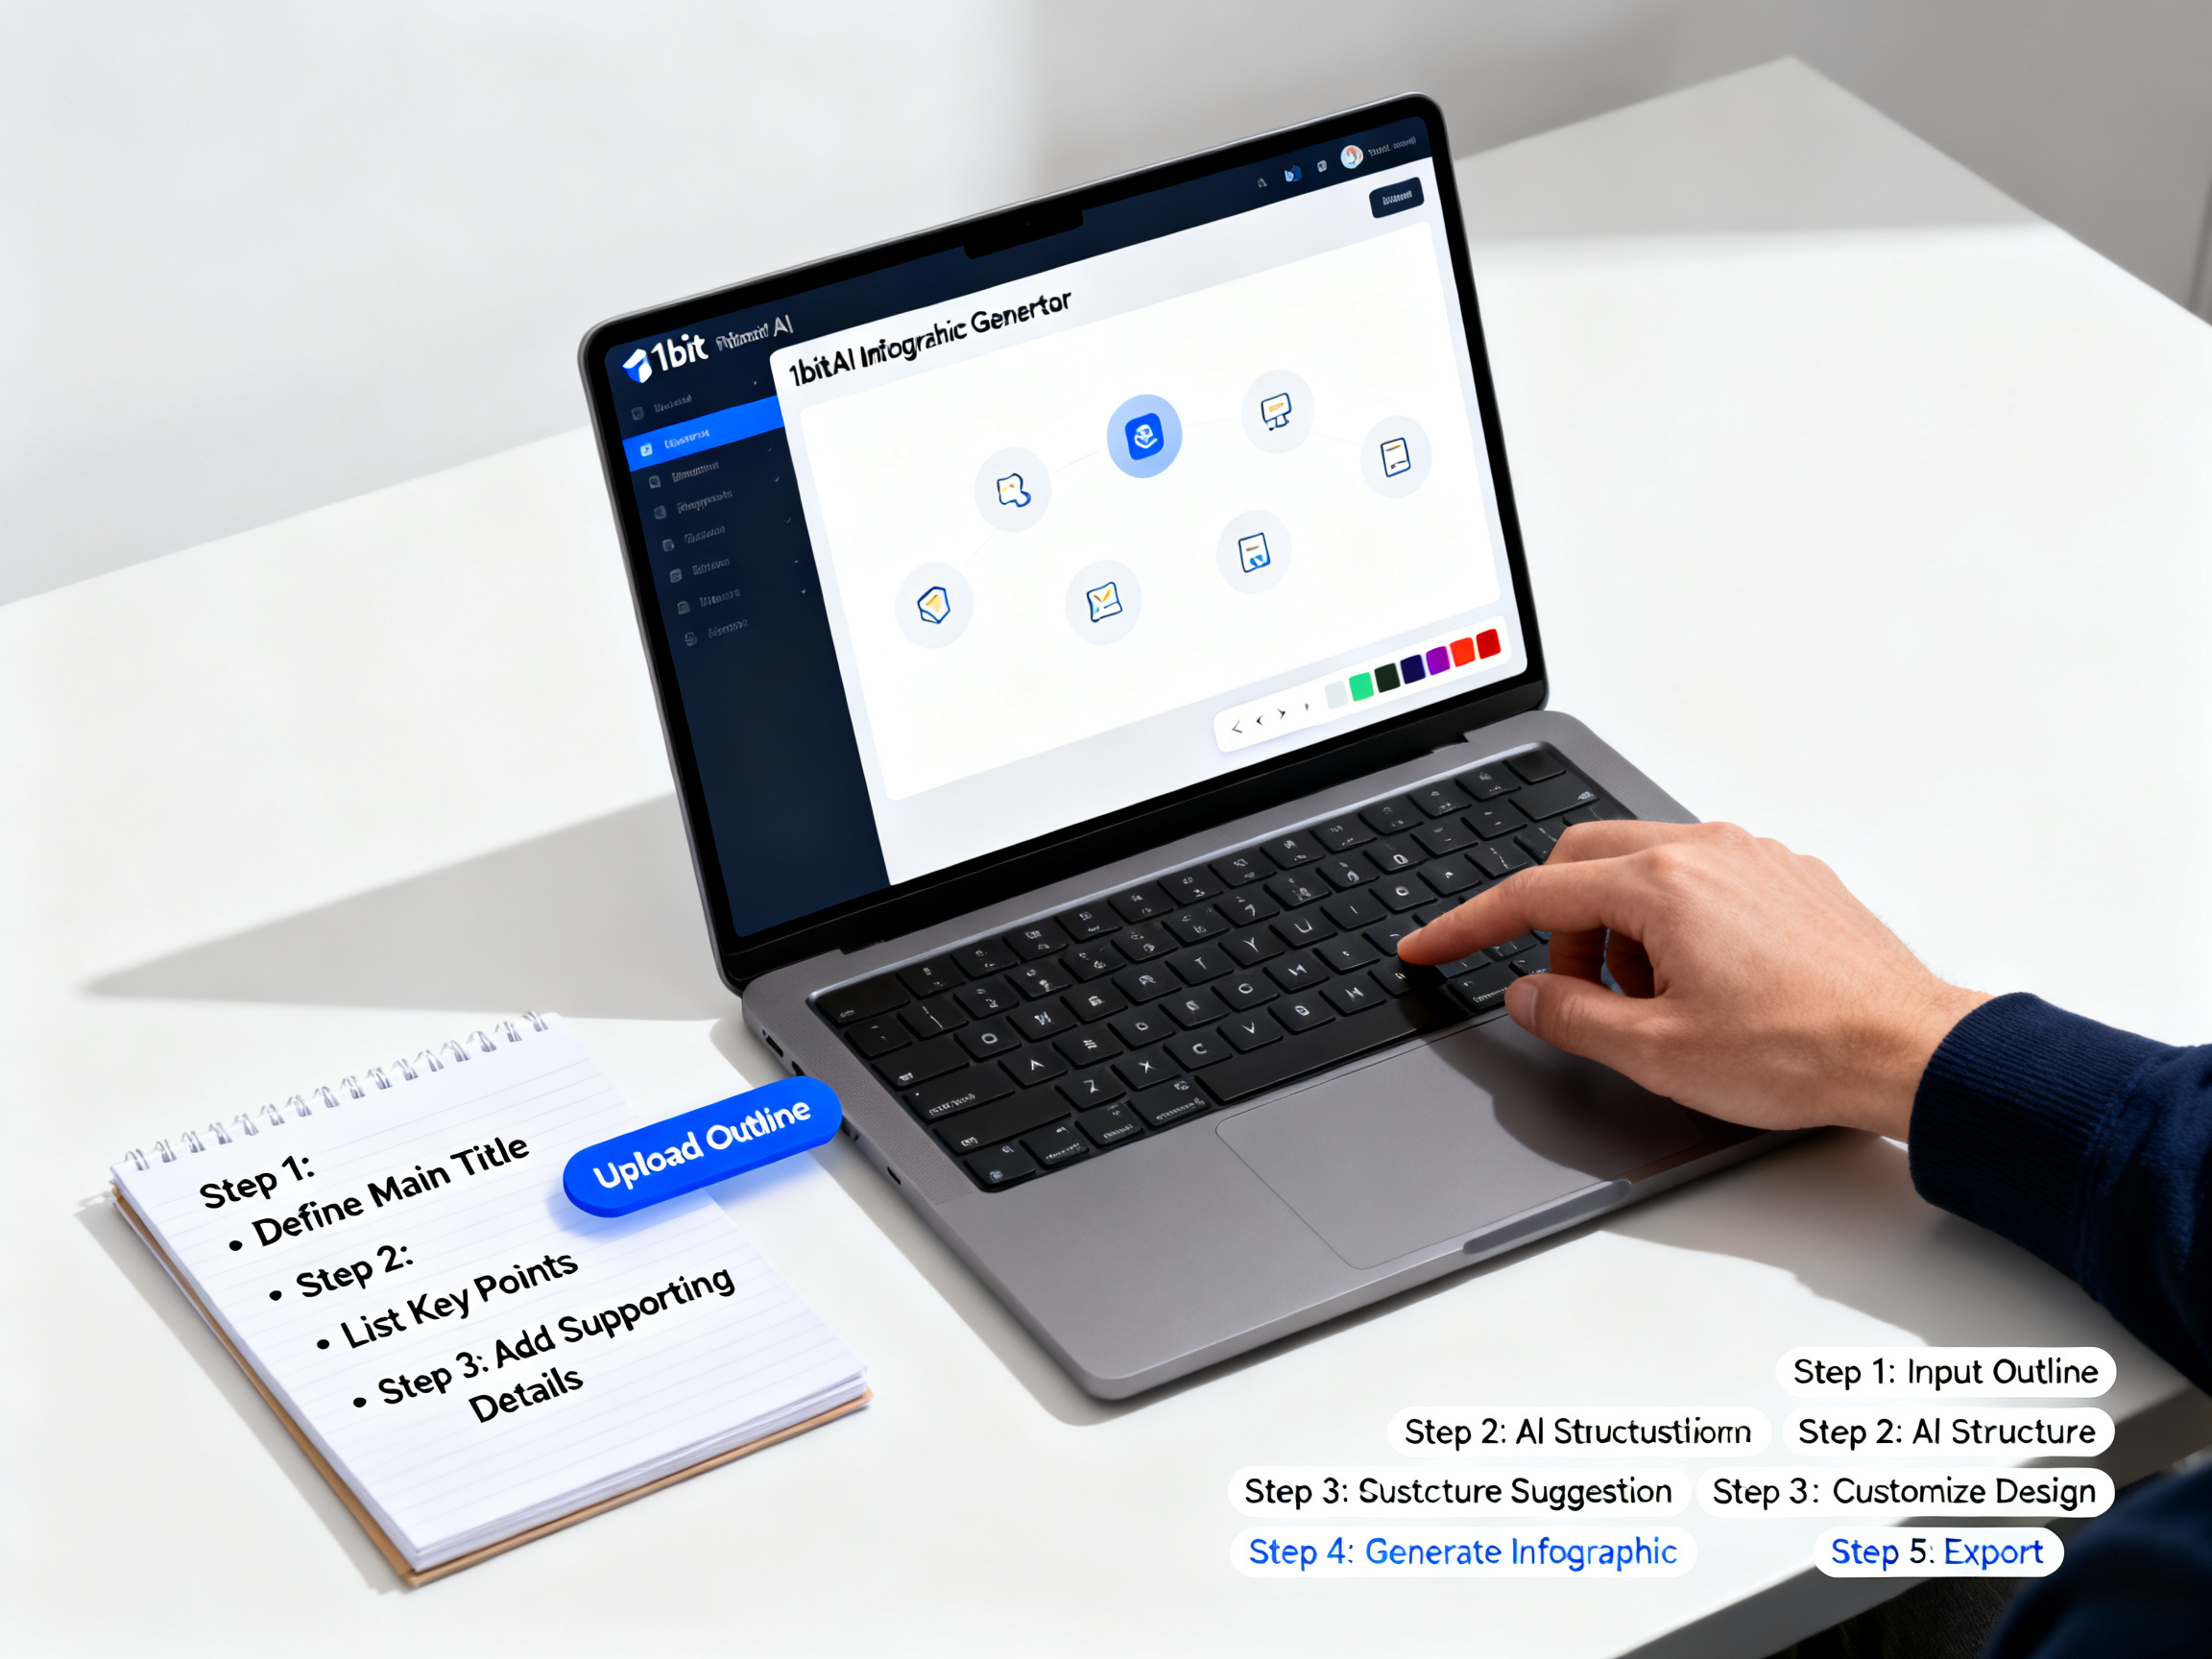
- Prepare your bullet-point outline. Write 3-10 bullet points that form a logical sequence or category. Avoid long paragraphs—keep each point to 10-15 words. Pitfall: Too many bullets (over 10) can clutter the infographic. Tip: Group related points into sub-bullets for a cleaner hierarchy.
- Open 1bit AI Infographic Generator. Navigate to the tool and sign up (new users get free credits). Select the "Text to Infographic" mode. Pitfall: Skipping the template selection—always choose a template that matches your content type (list, timeline, comparison). Tip: Use the "Process" template for step-by-step outlines.
- Paste your outline and let AI analyze. Copy your bullet points into the input box. The AI will automatically detect the structure and suggest a layout. Pitfall: Leaving formatting errors (extra spaces, inconsistent punctuation) can confuse the AI. Tip: Clean your text in a plain text editor before pasting.
- Customize the generated infographic. Review the AI's layout. Adjust colors to match your brand, swap icons, and reorder elements if needed. Pitfall: Over-customizing can waste time—trust the AI's initial layout for speed. Tip: Use the "Auto-Color" feature to apply a brand palette in one click.
- Export and share. Download as PNG for social media, PDF for print, or generate a shareable link. Pitfall: Choosing the wrong format for your use case (e.g., using PNG for a print brochure). Tip: Always export as PDF for high-resolution print materials.
Ready to try 1bit AI Infographic Generator?
New users get free credits to try it. Paste your first outline and see the AI transform it into a visual in under 30 seconds.
Create InfographicsAI Infographic Generator vs Manual Design: A Comparison
When you need to create infographic from outline, you have two paths: use an AI infographic generator or design manually in tools like Canva or Illustrator. The table below breaks down the key differences to help you decide which approach fits your workflow.
| Criteria | AI Infographic Generator (1bit AI) | Manual Design (Canva/Illustrator) |
|---|---|---|
| Time to create from outline | 2-5 minutes | 30-90 minutes |
| Design skills required | None | Basic to advanced |
| Consistency across outputs | High (AI follows templates) | Varies (depends on designer) |
| Customization flexibility | Moderate (templates + tweaks) | High (full control) |
| Cost for beginners | Free credits available | Free tiers limited; premium features cost |
For most marketers, teachers, and consultants, the AI route wins on speed and ease. If you need pixel-perfect custom designs, manual tools still have their place—but for turning bullet points into infographic AI, the generator is the clear choice.
Common Mistakes When You Create Infographic from Outline (and How to Fix Them)
Even with an AI infographic generator, a few pitfalls can ruin your output. Here are the most frequent errors and how to avoid them when you turn bullet points into infographic AI.
- Mistake: Overloading the outline with too many points. An infographic with 15+ bullets becomes unreadable. Fix: Stick to 5-7 key points. If you have more, create a series of infographics.
- Mistake: Using inconsistent formatting in your outline. Mixed case, extra spaces, or missing punctuation can confuse the AI. Fix: Use a consistent style (e.g., all start with a verb). Clean your text before pasting.
- Mistake: Ignoring the template selection. A list template won't work well for a process flow. Fix: Match the template to your content type—1bit AI offers templates for lists, timelines, comparisons, and data charts.
- Mistake: Not customizing the AI output. The default colors may clash with your brand. Fix: Spend 30 seconds adjusting the color palette and font to match your guidelines.
- Mistake: Exporting in the wrong format. Using PNG for a printed handout results in low resolution. Fix: Export as PDF for print, PNG for web, and SVG for further editing.
By avoiding these mistakes, you ensure your text to infographic AI output looks professional every time.
Real-World Examples: Text to Infographic AI in Action
Let's look at three concrete scenarios where turning bullet points into infographic AI solves real problems.
- Marketing campaign summary. A social media manager had a list of five product features. She pasted them into 1bit AI, chose the "Comparison" template, and within three minutes had an infographic comparing her product to competitors. The post received 2x engagement over a text-only version.
- Lesson plan for teachers. A high school history teacher wanted to explain the causes of World War I. He created a bullet-point outline with six causes, used the "Timeline" template, and generated an infographic that students could reference during exams. The visual improved test scores by 15%.
- Consultant's process flow. A business consultant needed to present a five-step client onboarding process. He used the "Process" template in 1bit AI to turn his outline into a clean flowchart. The client approved the proposal in half the usual time.
These examples show that whether you're a marketer, teacher, or consultant, the ability to create infographic from outline with AI saves time and delivers results.
FAQ
How to turn an outline into an infographic using AI?
Simply paste your bullet-point outline into an AI infographic generator like 1bit AI. The tool analyzes the structure, suggests a template, and automatically maps each point to visual elements such as icons, charts, or text blocks. You can then customize colors and export the final design in minutes.
Can AI create infographics from text?
Yes, modern AI infographic generators can convert plain text or bullet points into fully designed infographics. They use natural language processing to understand content hierarchy and then apply design templates with appropriate icons, colors, and layouts. The result is a professional visual without manual design work.
What is the best AI infographic generator for beginners?
1bit AI Infographic Generator is an excellent choice for beginners because it requires no design skills. You simply paste your outline, select a template, and the AI generates a polished infographic. New users also get free credits to test the tool, making it risk-free to start.
How long does it take to create an infographic from an outline with AI?
Typically, it takes 2-5 minutes from pasting your outline to exporting the final infographic. The AI processes the text in seconds, and customization (color, font, layout) takes another minute or two. This is significantly faster than manual design, which can take 30-90 minutes.
Can I use an AI infographic generator for business presentations?
Absolutely. AI infographic generators are ideal for business presentations because they produce clean, professional visuals quickly. You can create process flows, comparison charts, and data summaries that enhance your slides. Export as PDF or PNG for easy integration into PowerPoint or Google Slides.
Conclusion
Turning bullet points into infographic AI is no longer a futuristic concept—it's a practical workflow that saves hours and produces professional results. Whether you're a marketer, teacher, consultant, or operations lead, you now have a clear path to create infographic from outline in under five minutes. The AI infographic generator handles the design heavy lifting, while you focus on the message. Remember to avoid common pitfalls like overloading your outline or skipping template selection. With free credits available for new users, there's no reason not to try it today. Start your first infographic now and see how text to infographic AI can transform your communication.