In the world of education, visual learning is king.
The biggest challenge in teaching and learning isn't the lack of information—it's retention. Whether you are a teacher, a student, or a parent homeschooling your children, you know that a wall of text is the fastest way to lose engagement.
Visual learning is the key. But not everyone has the time (or skill) to use complex design software. Enter the 1bit AI Infographic Generator. This tool bridges the gap between abstract knowledge and visual understanding.
Use Case 1: Visualizing Invisible Forces (Physics)
Physics is daunting because it deals with invisible forces. Concepts like "acceleration" can be hard to grasp without a visual aid.
The Prompt:
"Draw a set of physics diagrams to explain the concept of 'acceleration', showing velocity vectors changing over time."
The Result:
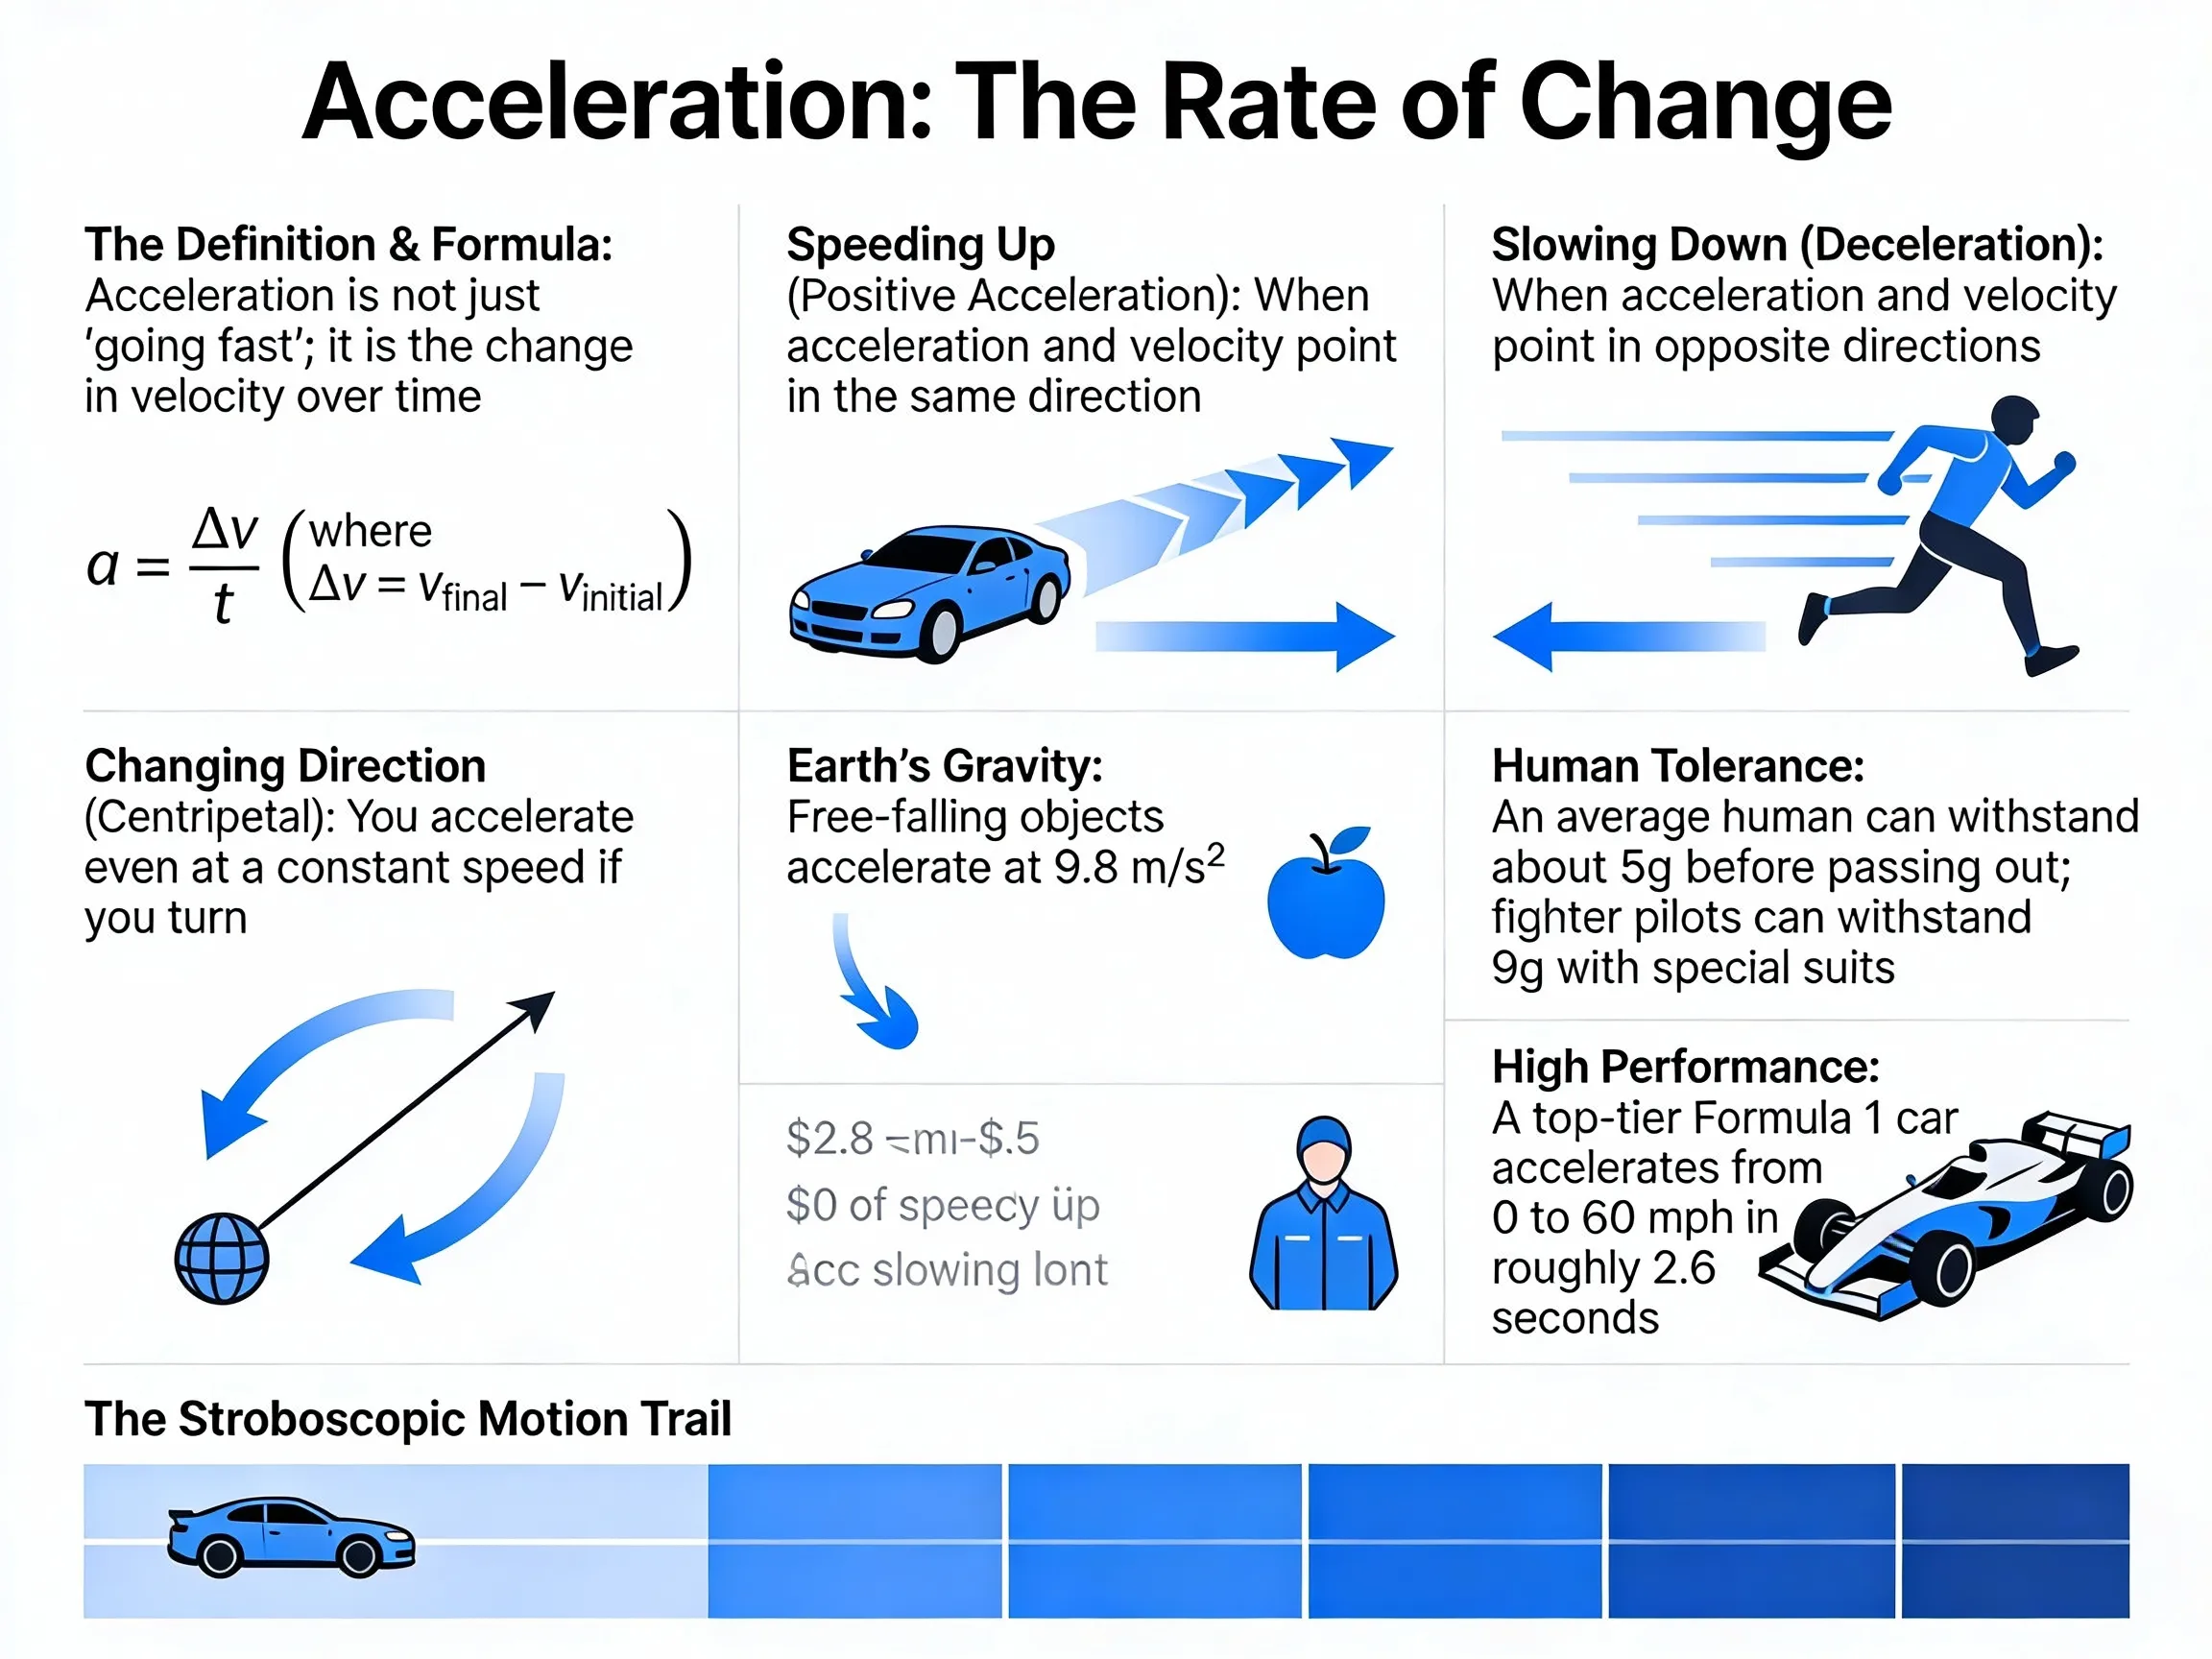 Turn abstract physics into clear visuals instantly.
Use Case 2: The Visual Encyclopedia (Geography)
Learning shouldn't be boring. When teaching younger students, the style matters. You can ask the AI to change the art style to make the information approachable.
The Prompt:
"Draw a vivid diagram of the water cycle, including evaporation, precipitation, and runoff, labeled clearly, with a cute 3D animation animation style."
The Result:
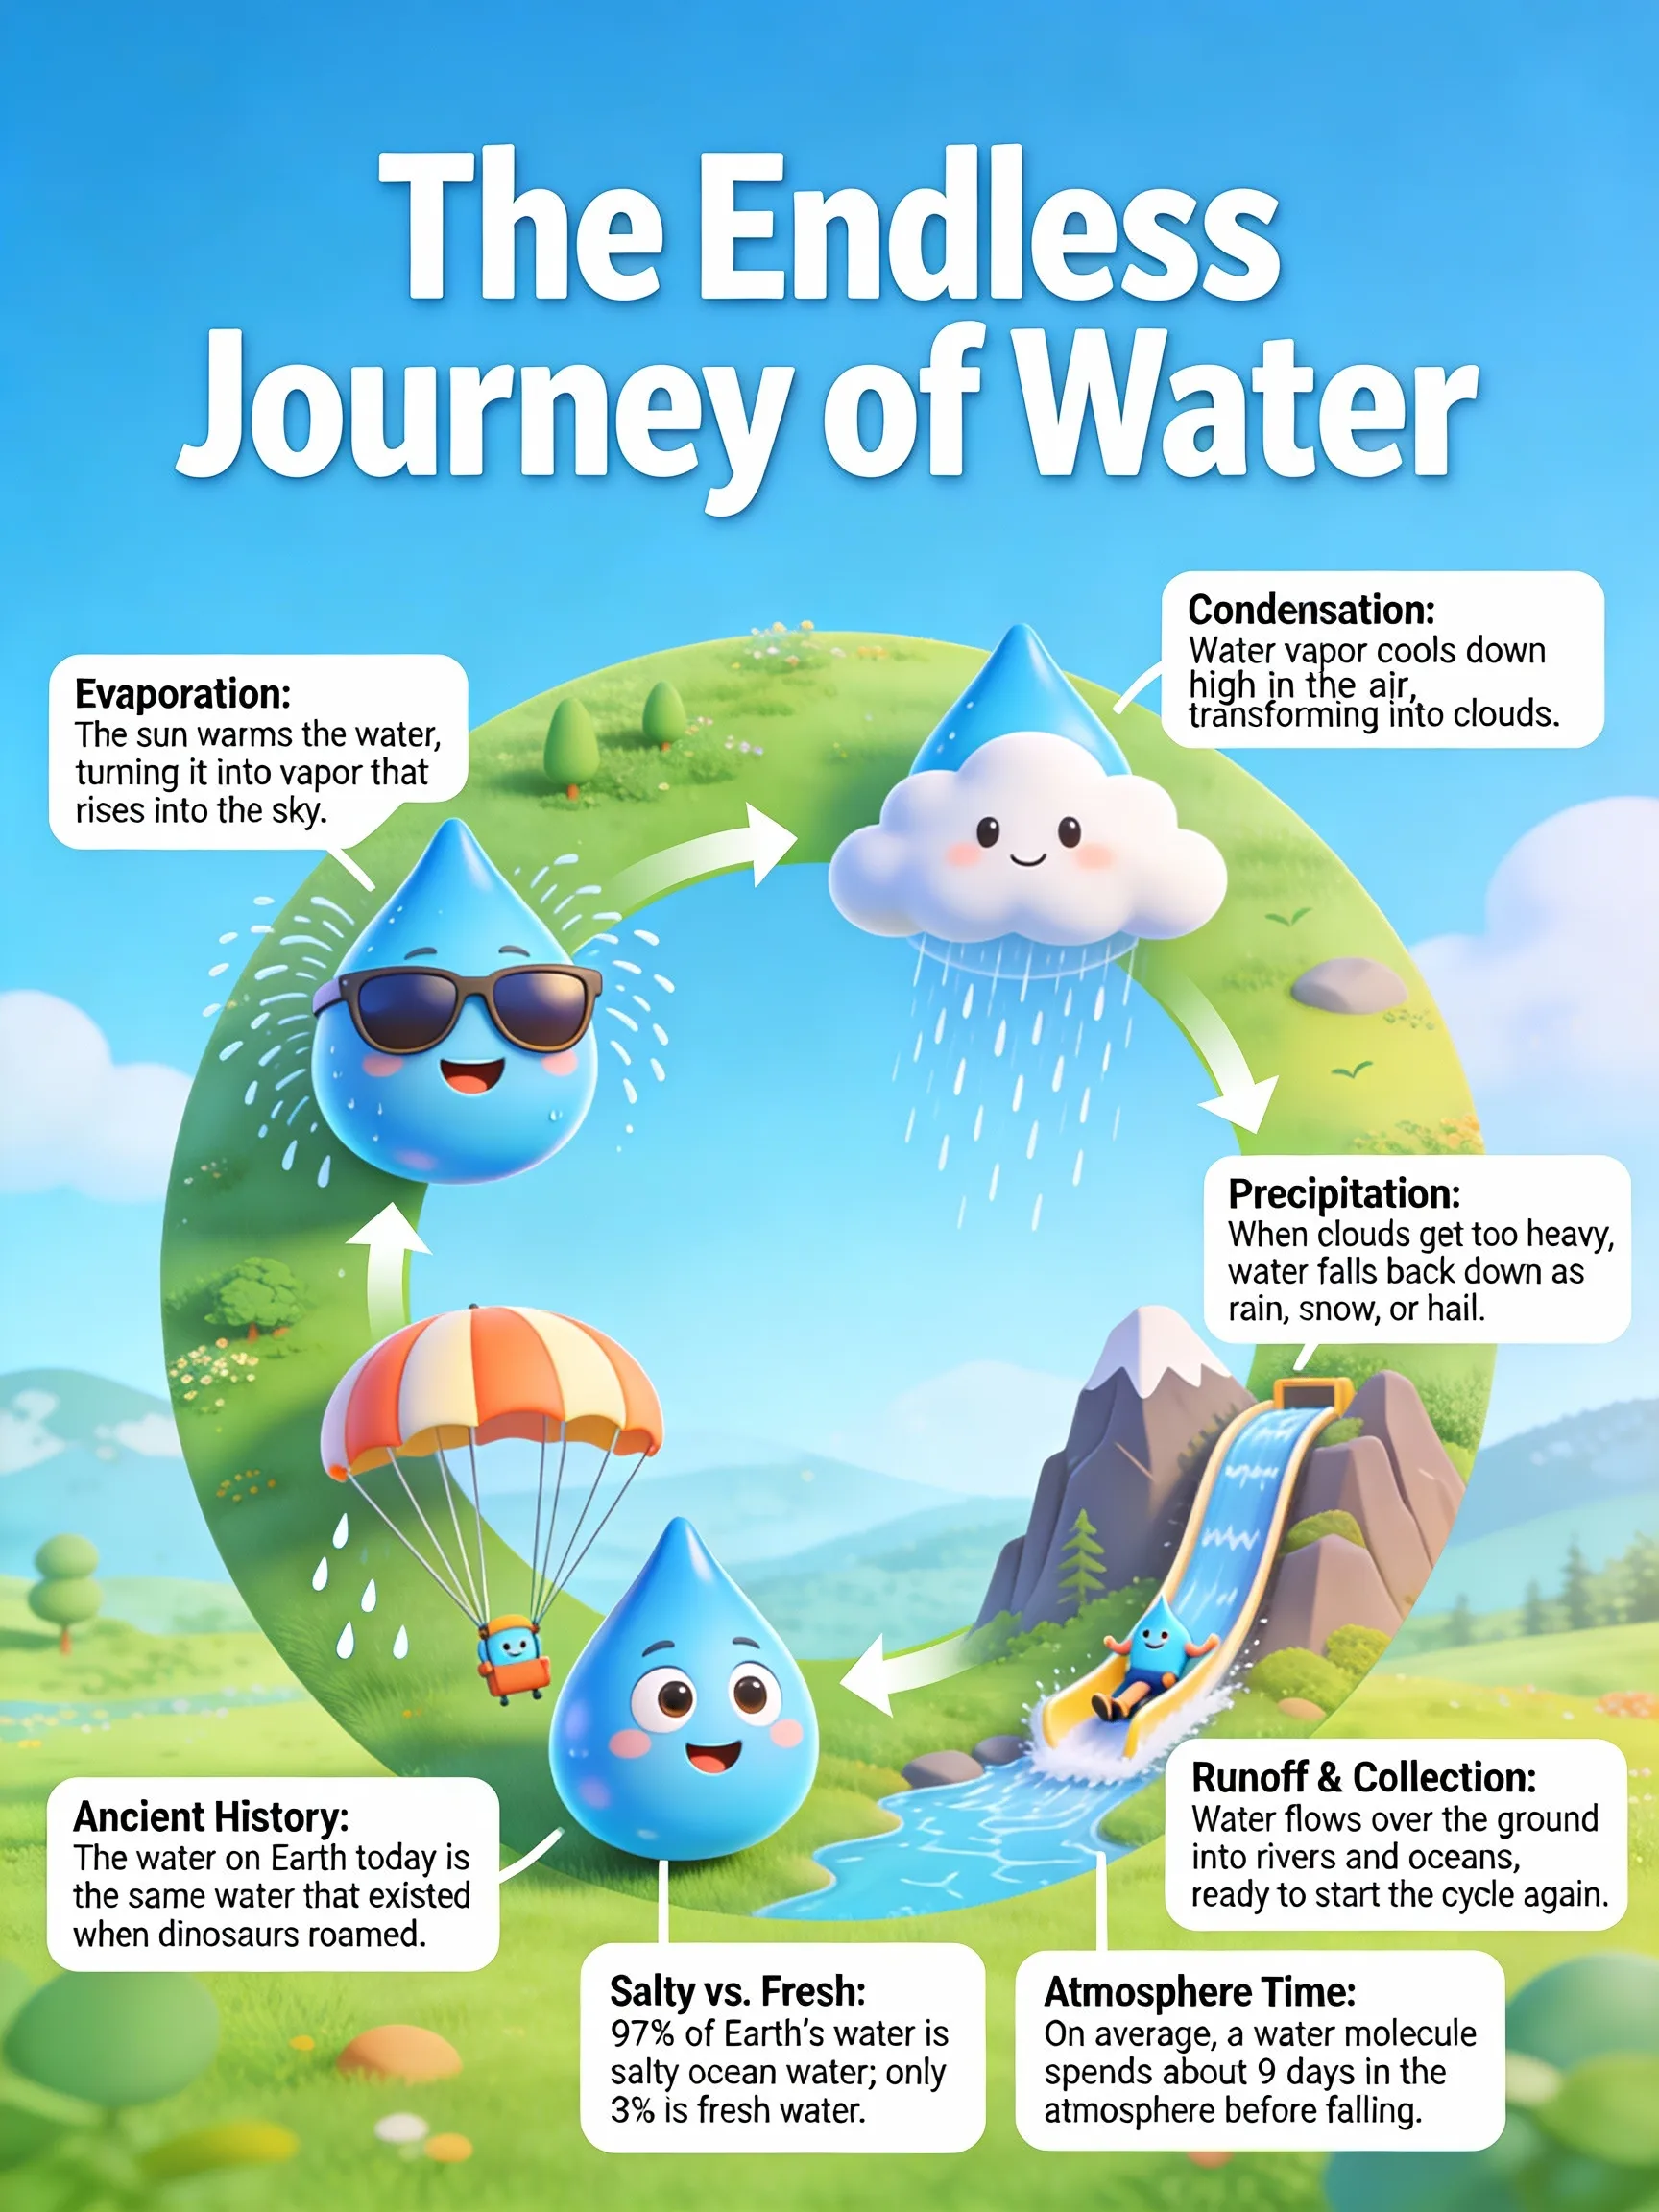 Make science fun with custom art styles.
Use Case 3: Detailed Anatomy (Biology)
Biology requires precision. Drawing detailed cell structures by hand is difficult. With AI, you can generate textbook-quality diagrams for revision notes.
The Prompt:
"Draw a detailed cross-section of a plant cell, labeling the nucleus, mitochondria, and cell wall, in a clean scientific textbook style."
The Result:
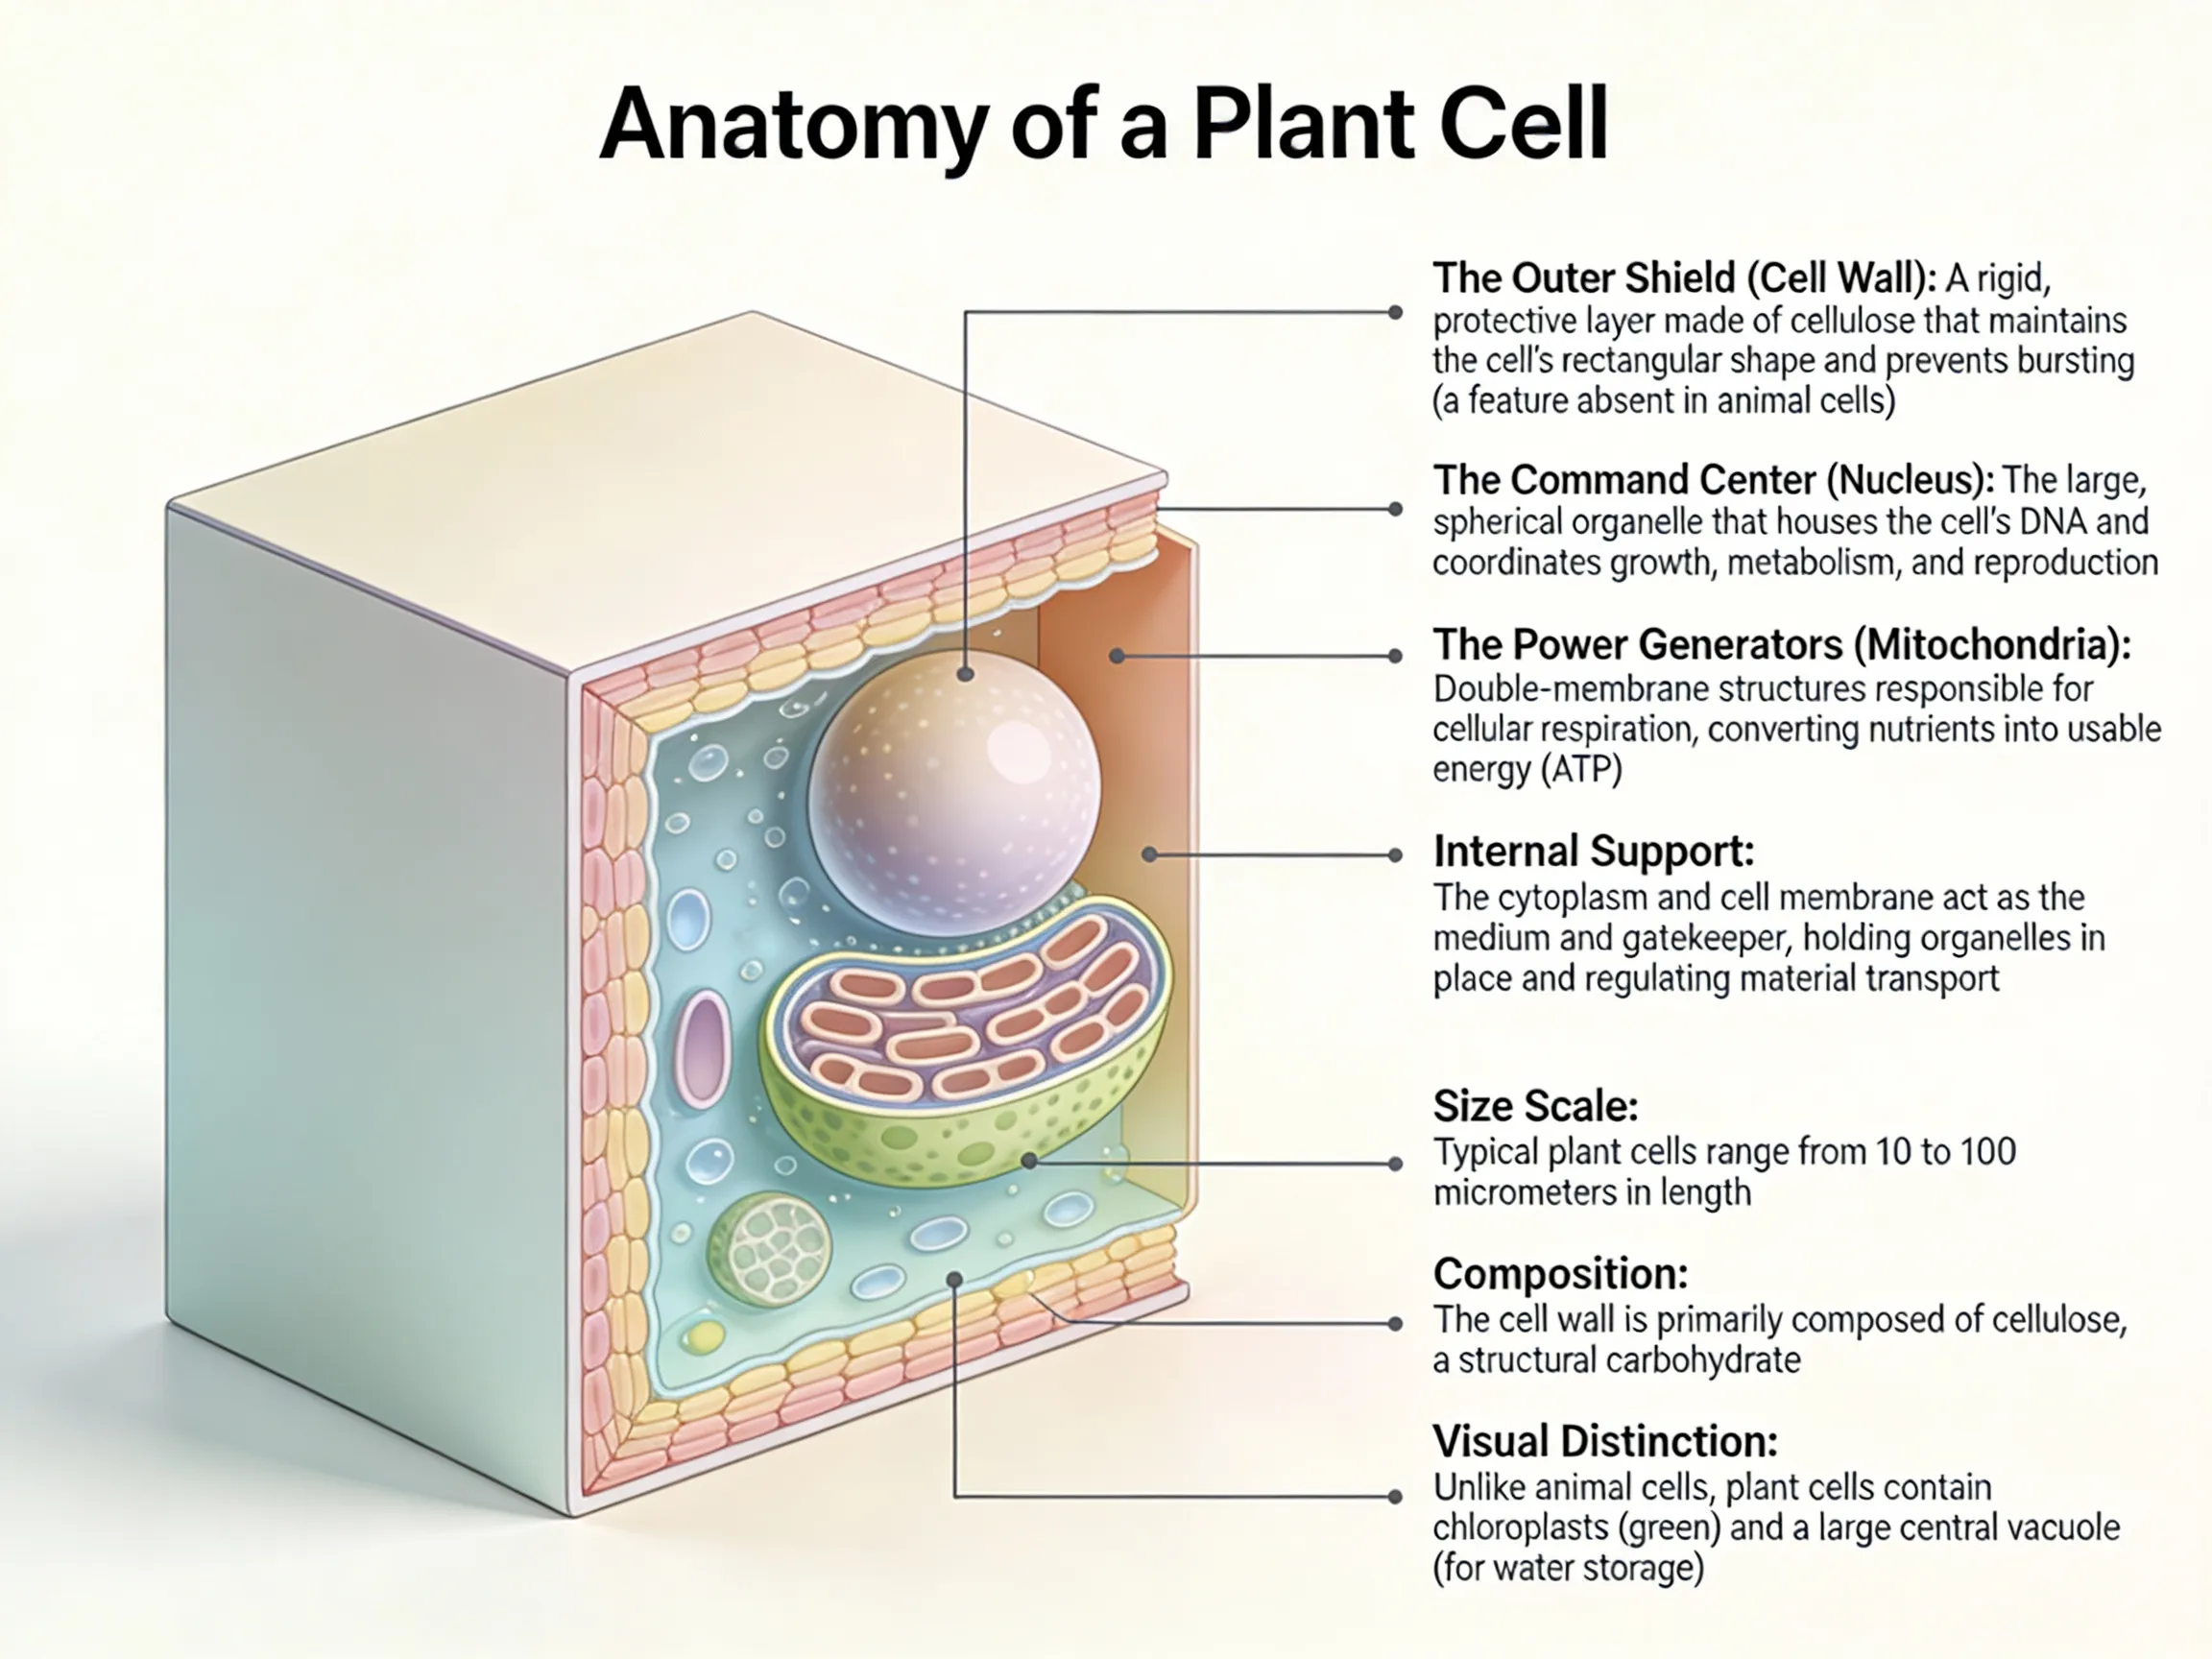 Professional biological diagrams in seconds.
Use Case 4: Visualizing Time (History)
History is a story. Timelines are excellent for visualizing cause and effect, but they are tedious to format manually.
The Prompt:
"Create a timeline infographic of the Industrial Revolution, highlighting key inventions like the steam engine, using a vintage parchment paper style."
The Result:
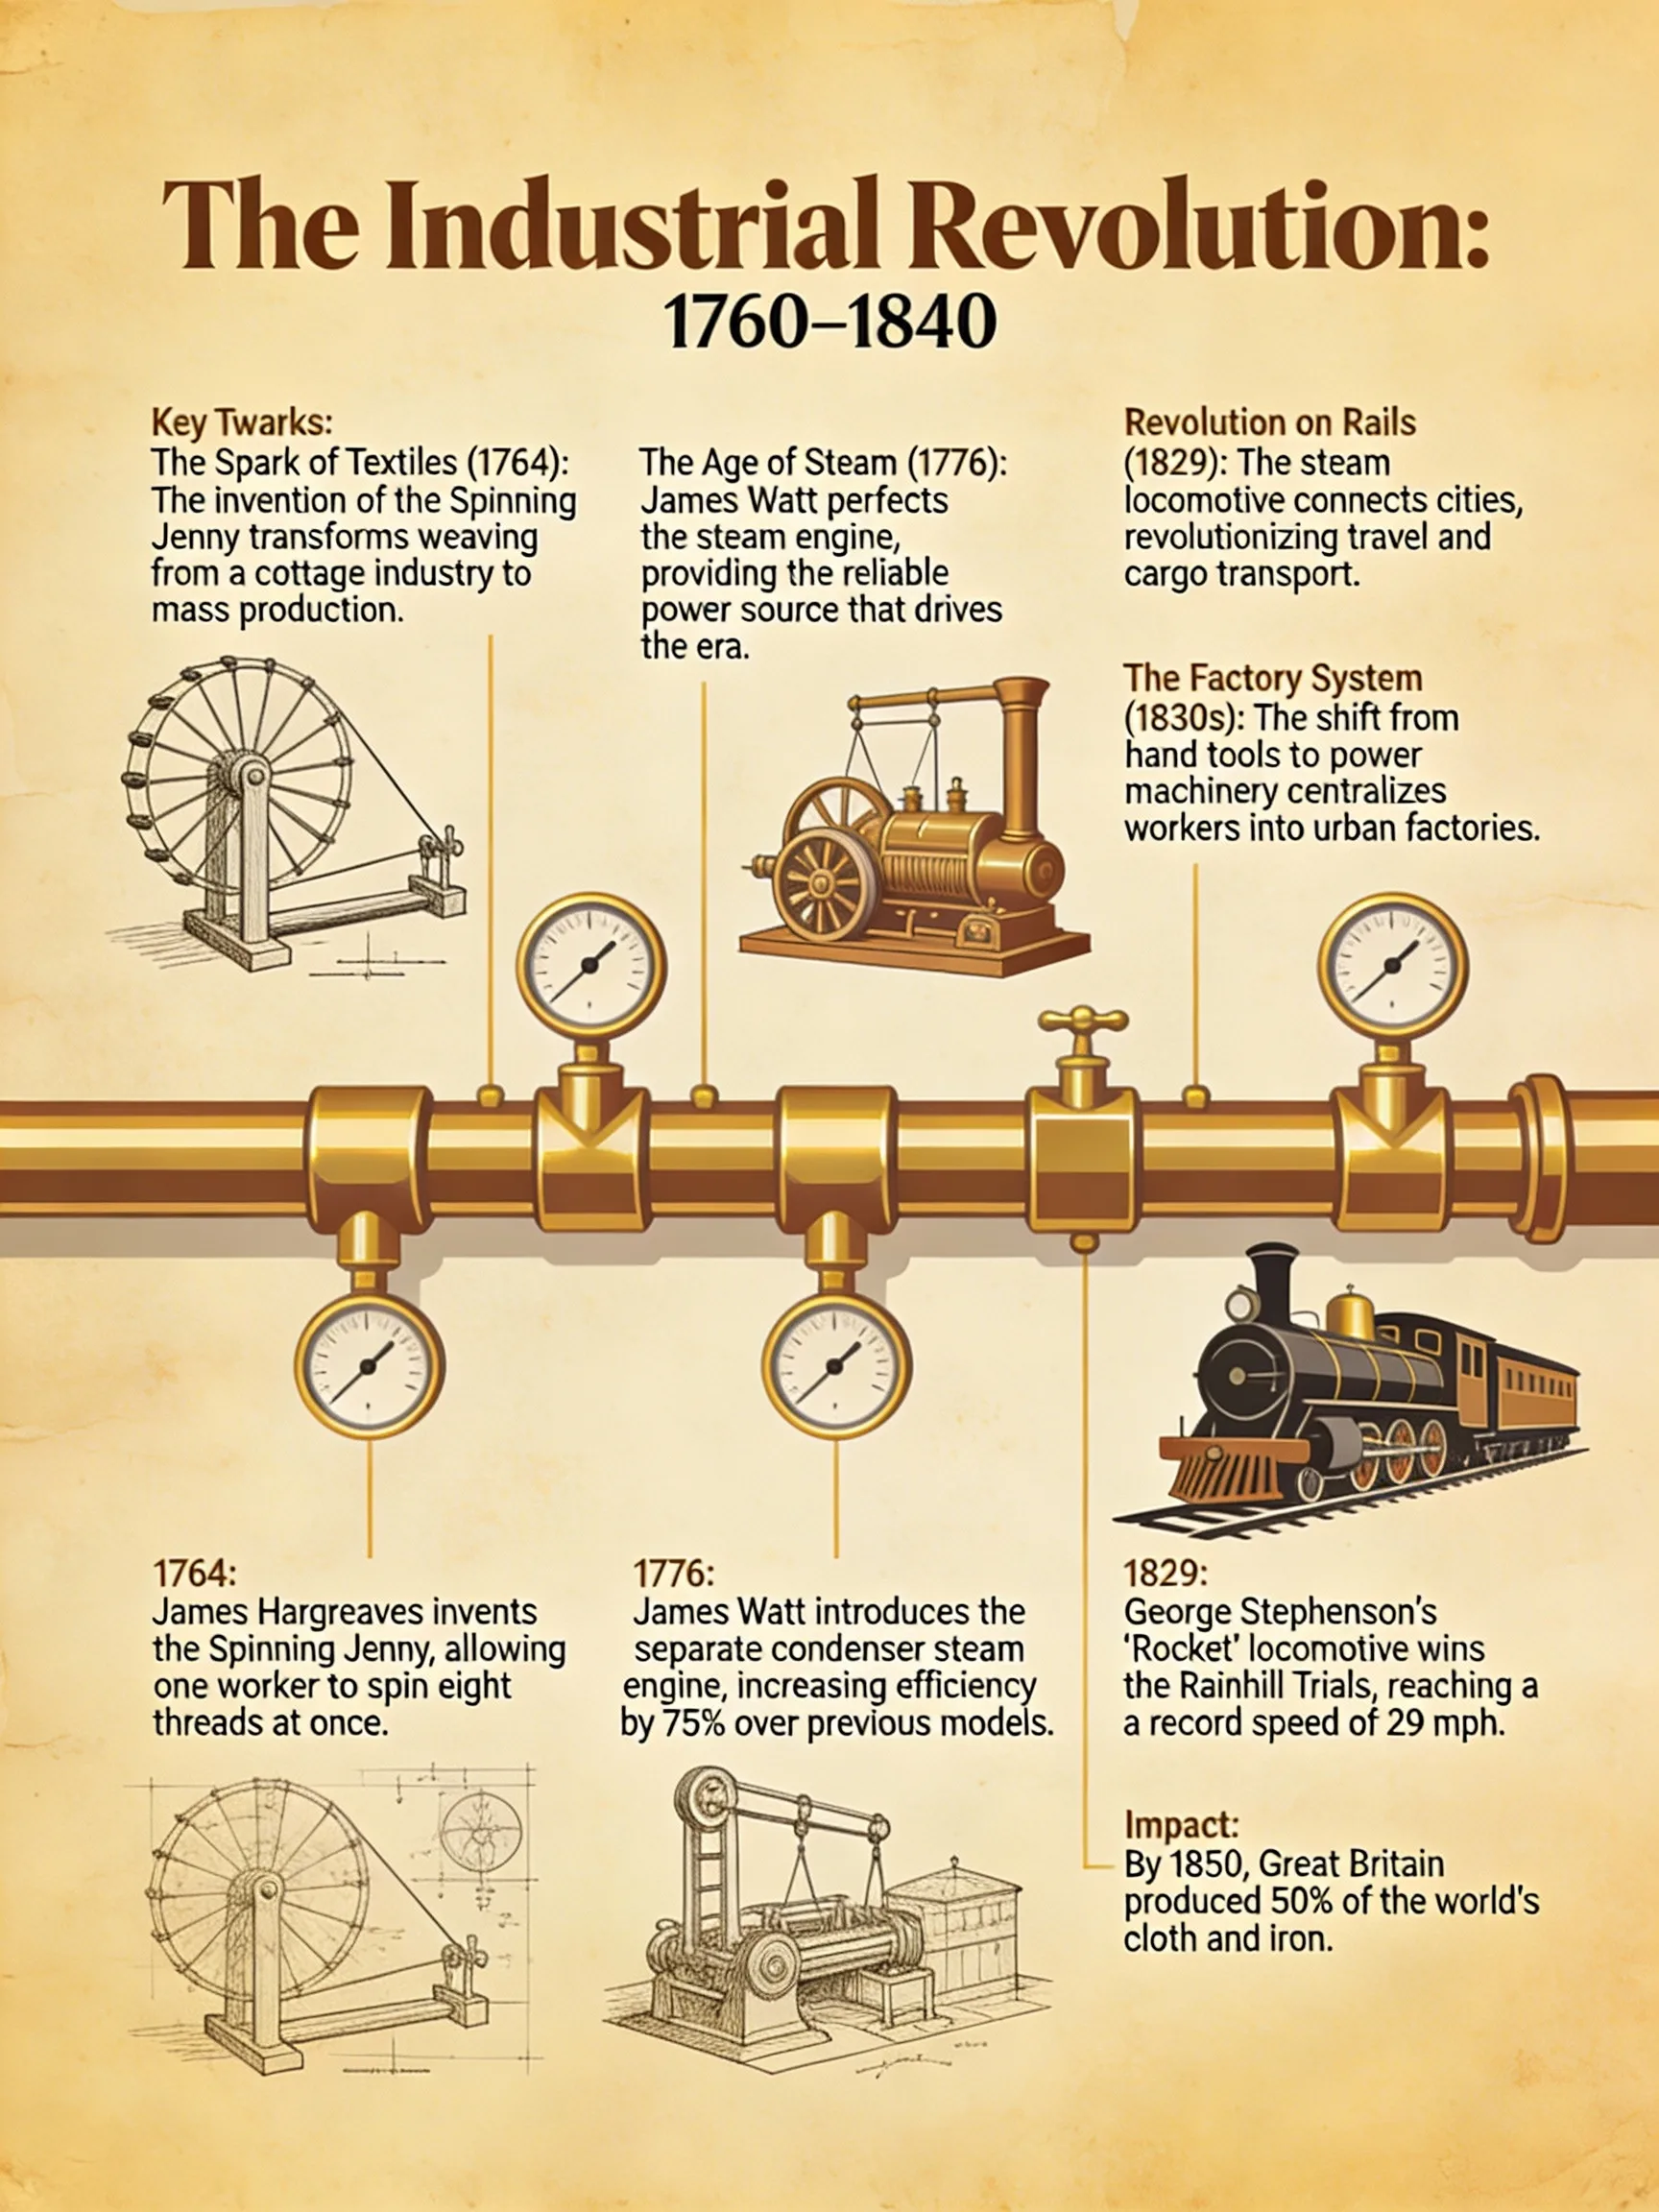 Bring history to life with stylistic timelines.
Start Creating Educational Visuals Today
Ready to revolutionize the way you teach? Stop struggling with design tools and start creating with words.